当社の信頼できる顧客
中東のスパイラル溶接パイプ市場調査、規模、傾向のハイライト(予測2025-2037年)
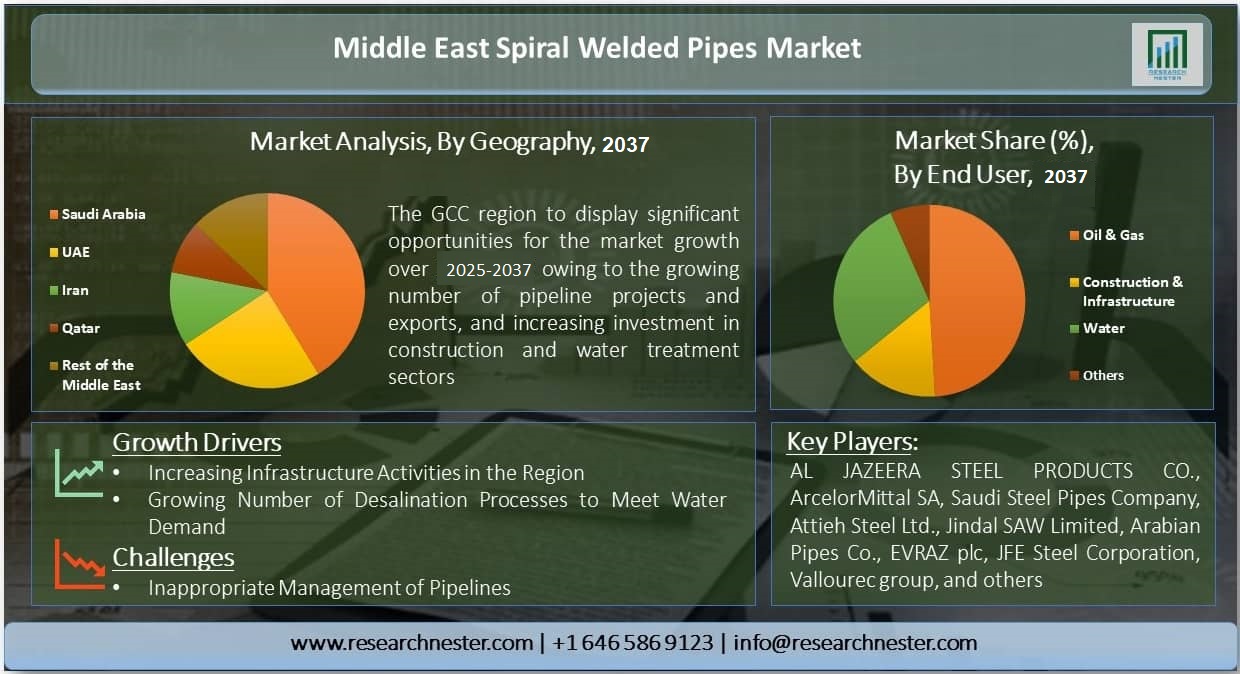
中東のスパイラル溶接パイプ市場は、予測期間、すなわち2025年から2037年にかけて注目すべきCAGRの7.3%で成長することにより、かなりの収益を得ると推定されています。市場の成長は、インフラ開発の成長、この地域の住宅および商業活動のためのスパイラル溶接パイプの用途の増加、および水を処理するための淡水化プラントの数の増加に起因する可能性があります。世界銀行によると、世界の脱塩水全体の70%は湾岸協力会議(GCC)の国々によって消費されています。これらとは別に、パイプラインは石油、水、化石燃料、およびいくつかの精製製品の重要な輸送モードとして広く採用されており、今後数年間でスパイラル溶接パイプの需要が高まると予想されます。
中東のスパイラル溶接パイプ市場の概要
地理的分析に基づいて、中東のスパイラル溶接パイプ市場は、イラン、GCC(サウジアラビア、アラブ首長国連邦、バーレーン、クウェート、カタール、オマーン)、その他の中東を含む3つの主要地域に分かれています。GCC地域の市場は、特にサウジアラビアやアラブ首長国連邦などの国々で、この地域でのパイプラインプロジェクトと石油輸出の増加を背景に、予測期間中に大幅な成長を目撃すると推定されています。

サンプル納品物ショーケース

過去のデータに基づく予測
会社の収益シェアモデル
地域市場分析
市場傾向分析
市場傾向分析

これらに加えて、サウジアラビアの不動産、インフラ、下水、石油化学などの産業への投資の増加も、近い将来、この地域の市場への成長を促進すると評価されています。サウジアラビアのインフラ部門の価値は、2019年にGCCで最も高く、630万ドル以上に達すると計算されました。さらに、カタールの市場も予測期間中に高い成長率で繁栄すると予想されており、これはFIFAワールドカップ2022やドーハメトロなどの将来の主要な建設ベンチャーに信用することができます。

中東のスパイラル溶接パイプ市場:成長要因と課題
成長の原動力
- この地域におけるインフラ開発の高まり
- 中東における海水淡水化プロセスの増加
課題
- 配管の漏えいに関するリスク
- パイプラインの不適切なメンテナンス
中東のスパイラル溶接パイプ市場のセグメンテーション
市場はエンドユーザーによって石油・ガス産業、石油化学産業、水産業にセグメント化されており、そのうち、石油・ガス産業セグメントは、石油・ガス部門で進行中の活動の数が多く、世界最大の石油生産者の多くが強い存在感を示しているため、中東のスパイラル溶接パイプ市場で最大のシェアを占めると予想されています。世界の石油の3分の1以上がサウジアラビア、イラク、アラブ首長国連邦、イラン、クウェートで生産されています。しかし、水産業のセグメントは、予測期間中に最も高いCAGRで成長すると評価されており、これはこの地域の人口増加による水の需要の激化に起因する可能性があります。
中東のスパイラル溶接パイプ市場の詳細な分析には、次のセグメントが含まれます。
タイプ別
- スパイラル水中アーク溶接(SSAW)パイプ
- 縦方向水中アーク溶接(LSAW)パイプ
- 電気抵抗溶接(ERW)パイプ
エンドユーザー別
- 石油・ガス産業
- 建設・インフラ産業
- 水産業
- 余人
アプリケーション別
- 原油輸送
- 精製品トランスミッション
- 天然ガス伝送
中東のスパイラル溶接パイプ市場を席巻している企業:
- Al Jazeera Steel Products Co., Ltd.
- 会社概要
- 事業戦略
- 主な製品
- 財務実績
- 主要業績評価指標
- リスク分析
- 最近の開発
- 地域的なプレゼンス
- SWOT分析
- ArcelorMittal SA
- Saudi Steel Pipe Company
- Attie Steel Co., Ltd.
- Jindal SAW Limited
- Arabia Pipes Co., Ltd.
- Rezayat Group (National Pipe Company Co., Ltd.)
- Evraz plc
- JFE Steel Corporation
- Valurec Group
目次

このレポートの詳細については。
お客様の個人情報は安全かつ機密に保たれます。 個人情報保護方針